What Is Workplace Violence Actually Costing
Your Health System?
Most healthcare organizations can't answer this question.
This video shows you exactly how to build the number — and use it.
Workplace violence is one of the largest unquantified financial liabilities in healthcare. Not because the data doesn't exist — it does. Your finance team is already tracking most of it, scattered across four departments: workers' compensation, restricted work time, incident-driven overtime, and staff turnover. The problem is those numbers have never been aggregated into a single fiscal picture leadership can act on.
This 60-minute framework tutorial changes that. You'll leave with access to a calculate your own cost breakdown.
Key Takeaways: Your Role Saves Lives
- Observation = protection
- Communication = trust
- Documentation = safety + legal defense
- Emergency readiness + self-care = sustained effectiveness
- “When you protect yourself, you protect your patients.”
Downloadable Resources:
🔗 Patient Care Safety Monitor Simulation — Debrief Guide
🔗 Patient Care Safety Monitor — Safety Pledge
Related Three-Part Blog Series:
Part 1: Understanding the Role of Patient Care Safety Monitors
Part 2: Beyond the Chart—How Communication & Documentation Save Lives
Part 3:Seconds Matter—Emergency Response, Self-Care, and Staying Ready
Who Should Watch This?
Built for CNOs, COOs, CFOs, safety leaders and workplace violence committee members who need the financial evidence and executive language to secure leadership support and funding.
What Will You Learn?
-
The four-category cost framework: How to identify and aggregate the WPV cost data your finance team is already tracking and produce a single defensible number.
-
The ROI case your C-suite hasn't seen: Why the return on structured WPV prevention is stronger than most leadership teams believe, and how to present it in language that moves a CFO.
-
Real benchmarks: What organizations with structured WPV prevention programs consistently see in workers' comp reduction, lost work days, and staff retention.
-
OSHA 300 log as a business case: Why OSHA is now using it that way and how you can too.
-
An actionable framework: A cross-functional data aggregation approach your WPV prevention committee can operationalize immediately after the webinar.
Resources mentioned in this video:


Once I was able to show data to our executives that we were loosing [several million dollars] a year to workplace violence, [a fraction of that cost] to train everyone with Vistelar didn't sound like a lot [and we got the funding we needed].
What this Video Teaches us - A Summary:
The True Cost of Workplace Violence in Healthcare — And How to Build the Business Case to Fix It
Workplace violence costs U.S. hospitals an estimated $18.27 billion every year* — yet most healthcare leaders can't point to a single number for what it's costing their own organization. The data exists. It's just scattered across workers' comp claims, HR turnover reports, OSHA 300 logs, and risk management files that rarely talk to each other.
In this on-demand webinar, Vistelar COO Casey Goldschmidt breaks down how healthcare operational leaders — security directors, safety officers, CNOs, and CHROs — can pull that fragmented data into one defensible baseline cost, benchmark it against peer hospitals, and use it to build a business case their C-suite can act on. Below is a summary of what's covered, with timestamps from the full recording above.
Why the Cost of Workplace Violence Is So Hard to See
Clinical staff are five times more likely to be assaulted at work than the average U.S. employee — but the downstream costs of that exposure rarely land on one desk. Injury and lost productivity costs sit with risk management and HR. Turnover costs sit with HR and nursing administration. Post-incident response costs span finance, quality, and legal. Regulatory exposure sits with legal and compliance. Security holds its own incident data on top of all of it.
That fragmentation is exactly why workplace violence is so hard to bring forward as a capital priority — not because the cost isn't real, but because no one owns the full picture.
How Much Does Workplace Violence Actually Cost Hospitals?
Nationally, workplace violence costs U.S. hospitals $18.27 billion annually* — an average of roughly $3 million per hospital across the more than 6,100 hospitals in the U.S. Of that:
-
$2.1 billion is tied to workers' compensation costs alone — about $340,000 per hospital**
-
The average workers' comp claim costs approximately $28,000**
-
Claims specifically tied to workplace violence can run $300,000–$400,000, depending on severity and acuity**
-
These are aggregate, national averages — a starting point for understanding scale, not a substitute for your own facility's numbers.
-
What Workplace Violence Prevention Programs Actually Deliver
-
The return on investment isn't theoretical. Published research shows:
-
Workplace violence prevention programs can reduce incident rates by 18% to 66%***
-
One major pediatric health system sustained a 37% reduction in DART rate and a 48% reduction in incidents on target units after program investment***
-
A 35% reduction in workers' comp claims over three years has been shown to produce a 4:1 return on investment**
How to Calculate Your Own Baseline Cost
Your OSHA 300 log is the starting point for building your baseline — it already contains injury and illness type, days away from work, body part, nature of injury, department, and job title data. From there, the key inputs to aggregate are:
-
Workplace violence-related DART cases annually (days away, restricted, or transferred)
-
Workers' comp claims and medical expenses tied to workplace violence
-
Turnover attributed to workplace violence, and the cost to replace clinical vs. non-clinical staff
-
Total reportable workplace violence incidents
Vistelar's Workplace Violence Impact & ROI Calculator walks through each of these inputs and benchmarks the result against peer hospitals by bed size, region, and national data — and because it runs locally in the browser, none of the data entered is stored or visible to Vistelar.
What Each of Your Executive Stakeholders Needs to See
A workplace violence business case doesn't land the same way with every executive — each stakeholder is listening for a different signal:
-
COO — DART rate, days away from work, restricted days, agency spend, scheduling costs
-
CFO — Current cost baseline (workers' comp, premiums, claims), proposed fix, projected ROI over 2–5 years
-
CEO — Accreditation status, staff sentiment, outside optics, and how the case affects every other executive's priorities
-
Chief Risk Officer — Legal/regulatory exposure, OSHA citations, litigation history, insurance premium impact
-
CNO — Staffing levels, quality of care, and the downstream effect of turnover and burnout on patient care
-
CHRO — Recruiting difficulty, workers' comp entry trends, and exit interview data
Your 30-Day Action Plan
-
Week 1: Pull workers' comp claims, DART data, and agency/overtime spend from finance. Identify who owns your OSHA 300 log.
-
Weeks 1–2: Aggregate the data into a single document. Apply BLS and NSI benchmarks for your facility type and calculate your gap to peer benchmark.
-
By day 30: Build a stakeholder-specific one-pager for each C-suite member, model a five-year cost scenario (conservative and expected), and present preliminary findings to whichever executive you're closest with.
Data Report Sources:
*AHA Univ. of Washington Harborview 2025
**BLS SOII 2022/OSHA
***PMC scoping review, 2023
#faqs
Frequently Asked Questions
Have Question? We are here to help
How much does workplace violence cost U.S. hospitals per year?
An estimated $18.27 billion annually, or roughly $3 million per hospital on average — with $2.1 billion of that tied specifically to workers' compensation costs.
What is a DART rate?
DART stands for Days Away, Restricted, or Transferred — a standard OSHA metric used to track the severity of workplace injuries, including those related to workplace violence.
What ROI can healthcare organizations expect from workplace violence prevention programs?
Published data shows incident rate reductions of 18–66%, and a 35% reduction in workers' comp claims over three years has been shown to yield a 4:1 return on investment.
Where does the data for a workplace violence business case come from?
Primarily your OSHA 300 log, workers' comp claims and medical expense data, and HR turnover reports — aggregated into a single baseline cost figure.
Is workplace violence prevention data specific to my hospital, or industry-wide averages?
Both are useful: industry averages (BLS, NCCI, SHRM, PMC research) establish the scale of the problem, but a credible business case requires your own facility's baseline, which is what the ROI Calculator and a working session with our team are built to produce.
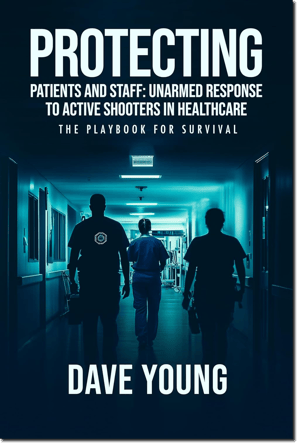
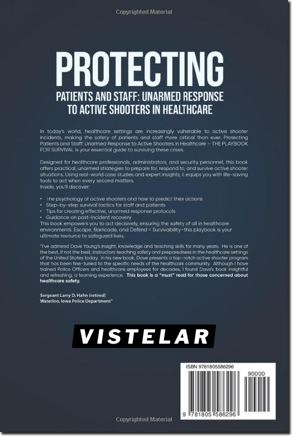
To get Dave Young’s book, Protecting | Patients and Staff: Unarmed Response to Active Shooters in Healthcare | The Playbook for Survival, click on the link to purchase it for a $5 discount and FREE shipping (normally $24.97 + cost of shipping). To get the full discount, simply choose the shipping option shown and it will automatically apply to the final price.