
The Cost of Workplace Violence in Healthcare:
Building the Business Case for Culture Change
The most-cited cost figure in this category does not measure what almost everyone thinks it measures. Here is what the data actually supports, and how to build the number for your own organization.
By Casey Goldschmidt, CEM | Chief Operating Officer, Vistelar
Most healthcare leaders already know they have a workplace violence problem. What they usually cannot tell you is what it costs them.
The instinct is to go looking for a national figure and scale it down. There is one, it is large, and it is quoted everywhere. It is also, for this purpose, the wrong number, and it is wrong in a way that nobody has bothered to check.
I have sat on both sides of this budget conversation. From the operations side, the problem looks like a program that cannot get funded because nobody can size it. From the finance side, it looks like a request built on a statistic the requester cannot defend when asked a second question about it. Both are true at once, and they reinforce each other. The safety leader brings a national aggregate. The CFO asks what it means here. The conversation ends.
This article is about ending it differently.
The $18.27 Billion Figure, Taken Apart
The most-cited estimate of workplace violence costs in U.S. healthcare includes more than workplace violence. Here's what the data actual shows.
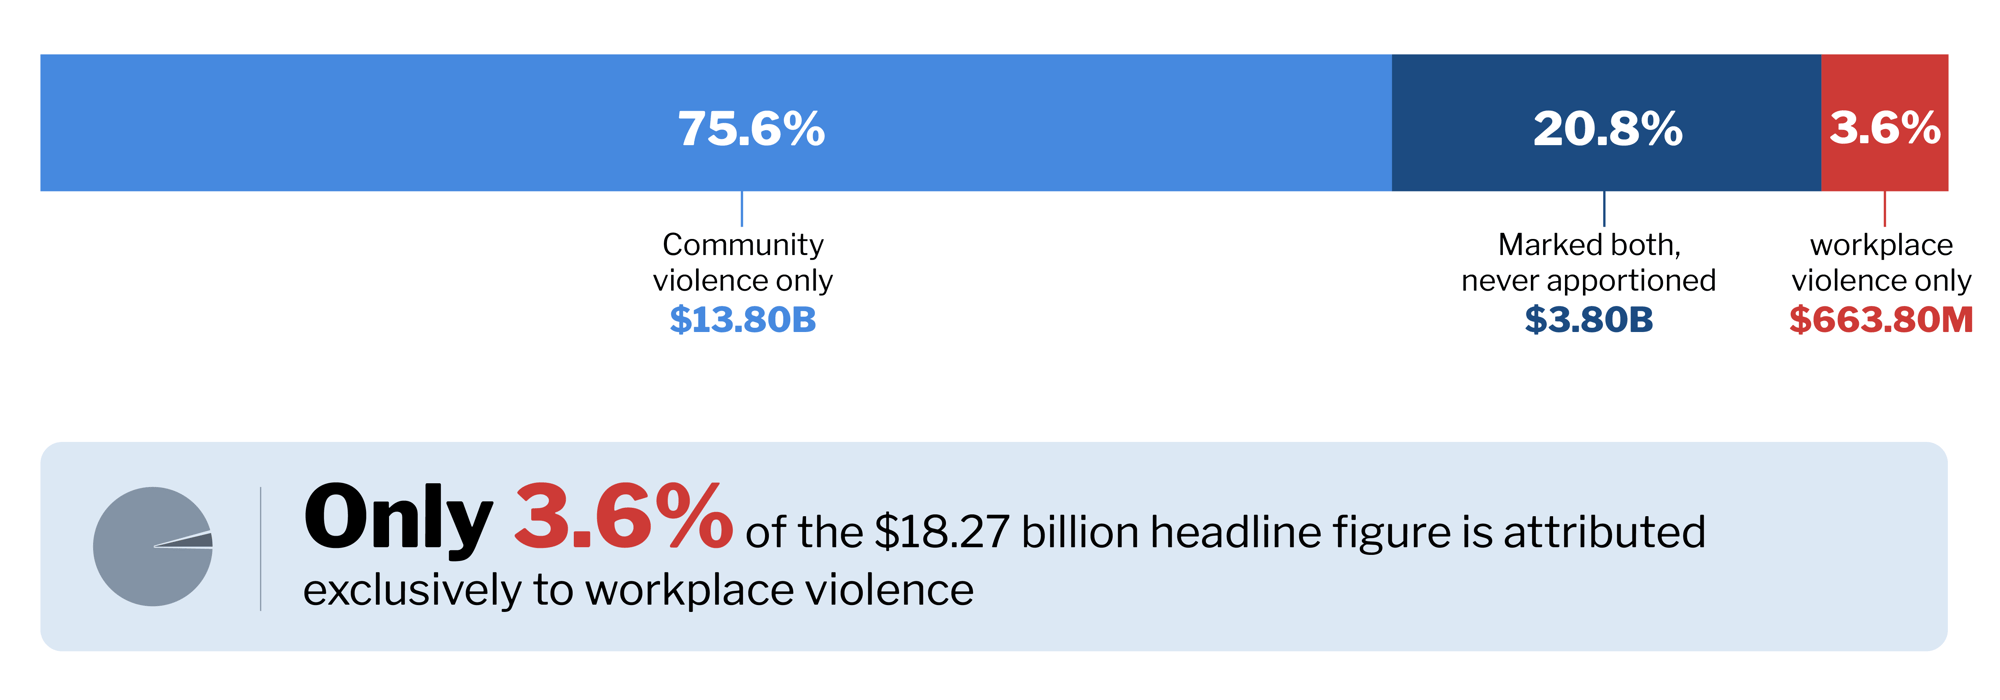
This is the number every article about workplace violence costs quotes. This is also, by the American Hospital Association's own classification, what is actually in it.
Jump To A Section
- The $18.27 billion figure, and what is actually in it
- Bringing it down to one employee
- What hospitals are already spending
- Four cost streams
- Build the number for your own hospital
- All the assumptions, in one place
- The number that settles the budget
- What underreporting does
- Setting the cost against what it costs to act
- Why culture is the variable
- Governance, or why funded programs still fade
- What studying our own program taught us
- Common objections in budget conversations
- FAQ
The $18.27 billion figure, and what is actually in it
In 2025 the American Hospital Association published The Burden of Violence to U.S. Hospitals, produced with the University of Washington's Harborview Injury Prevention and Research Center. Its headline: the total annual financial cost of violence to hospitals in 2023 was $18.27 billion.
That number now appears in trade press, association material, vendor content, and board decks, almost always described as the cost of workplace violence to hospitals.
Read the report's own title and the description changes. It is "A Comprehensive Assessment of Financial Costs and Other Impacts of Workplace and Community Violence." Read Table 1 and it changes again. AHA marks every cost line with the location of the violence that produced it, under a spanning column header that reads Location of Violence, subdivided into Community and Workplace. Each row carries a mark under one or both.
Here is what those marks say:
|
Cost category |
$ millions |
Location of Violence |
|
Pre-event financial costs |
3,620.5 |
|
|
Training costs |
1,403.7 |
Both |
|
Violence prevention programs |
959.2 |
Both |
|
Investments in technology to monitor possible events |
459.0 |
Both |
|
Security personnel and staffing |
404.3 |
Both |
|
Facility modification to prevent and mitigate harms |
306.0 |
Community |
|
Outreach to build public trust |
79.7 |
Community |
|
Policy and procedure development |
8.6 |
Both |
|
Post-event financial costs |
14,648.8 |
|
|
Health care costs for fatal and nonfatal injuries |
13,165.6 |
Community |
|
Replacement and repair of damaged infrastructure and equipment |
584.8 |
Workplace |
|
Staffing: absenteeism, productivity loss, turnover |
541.3 |
Both |
|
Case management |
252.5 |
Community |
|
Work loss costs for workers in the health care setting |
79.0 |
Workplace |
|
Community interface and public relations |
25.6 |
Both |
|
Total |
18,269.3 |
|
|
Marked |
$ millions |
Share of the headline |
|
Community violence only |
13,803.8 |
75.6% |
|
Marked both, never apportioned |
3,801.7 |
20.8% |
|
Workplace violence only |
663.8 |
3.6% |
3/4 of the most-cited workplace violence figure in American healthcare is marked, by the organization that published it, as community violence.
And the single largest line is the reason. The $13.17 billion for health care costs from fatal and nonfatal injuries is not a cost of violence against staff. It is what hospitals absorb treating victims of violence who arrive as patients, through uninsured care and public-payer underpayment. AHA is explicit that this figure "represents only the costs for which the hospital is responsible due to un/under-reimbursed care" and that it is 29.8% of an estimated $44.2 billion in total national treatment costs for violence-related injuries.
That is a real and serious cost. It is a community violence and payer-mix cost. No amount of de-escalation training changes it, because the people it describes were not injured in your building by your patients.
What that number is actually good for
None of this makes the report weak. It is the most careful work anyone has done on this question, its assumptions are disclosed, and AHA says plainly that they were "made so to be largely conservative in nature."
The problem is not the report. The problem is a citation habit that dropped half the title.
So use the figure for what it supports. It is a rigorous account of what violence in all its forms costs American hospitals in a year. It is not, and does not claim to be, a measure of what workplace violence costs a hospital. If you put $18.27 billion in front of a CFO as the size of your workplace violence problem, you are one search away from losing the room.
The report does not normalize its own total, and the obvious move, dividing by the number of hospitals, produces a misleading answer. American healthcare is concentrated. Most hospital employees work for large systems, so an average across every hospital in the country is an average of a distribution dominated by small facilities, and it will understate what a real organization is carrying.
So this article uses one unit throughout: dollars per hospital employee per year.
It is the unit that survives the industry's structure, it is the unit that scales with the risk, since violence happens to people rather than to buildings, and it is the one number every reader already knows about their own organization.
The Same Money, Per Employee
The $18.27 billion national figure, carried down to a single person on the payroll (6.2 million hospital employees).
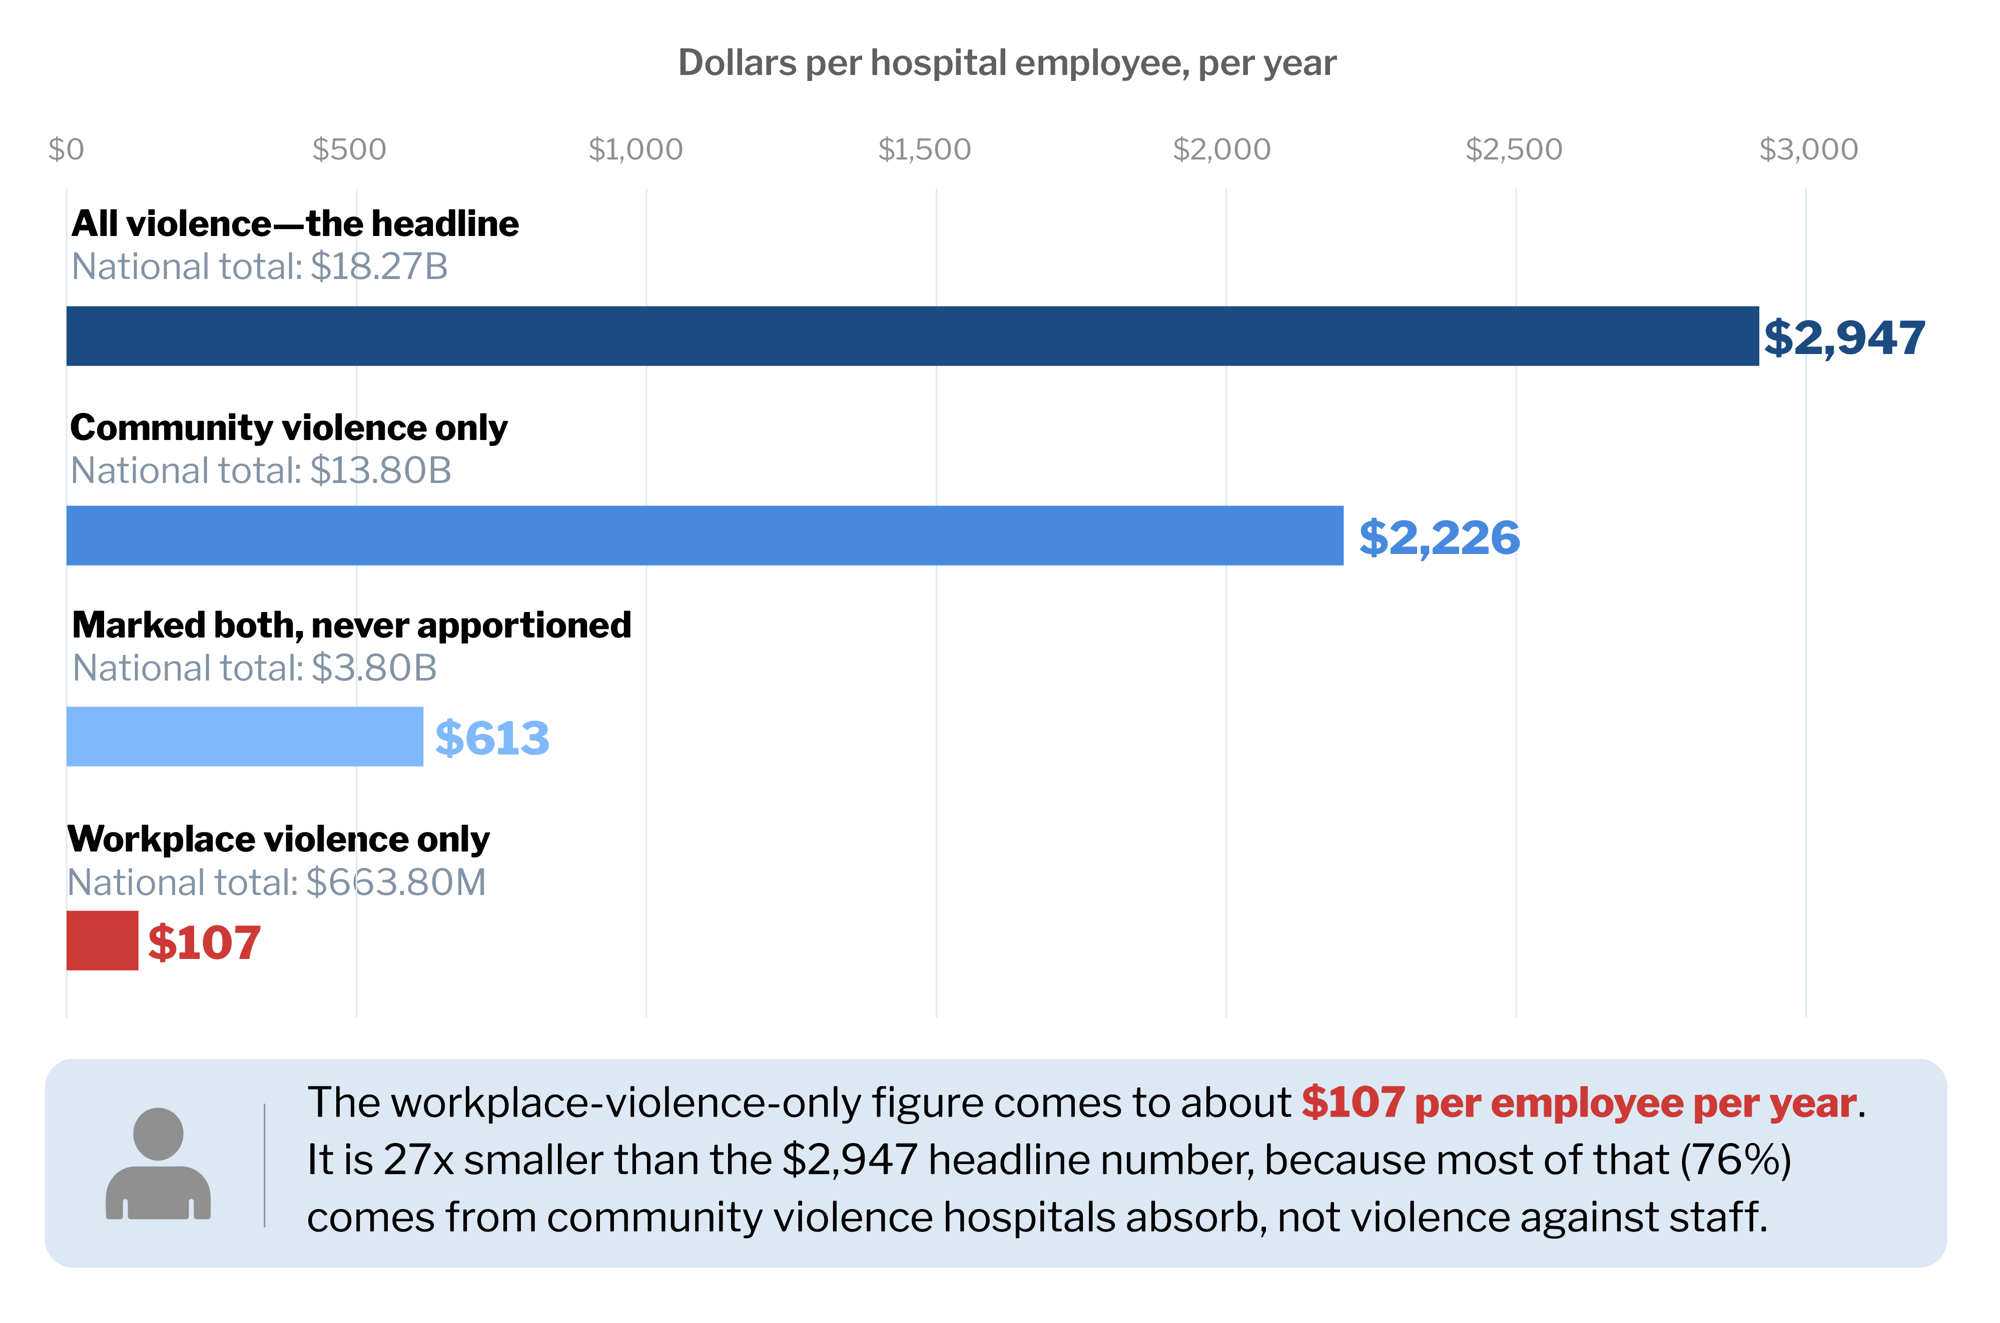
The national figure carried down to a single person on the payroll. We have not found this division published anywhere else, which is the more interesting fact.
|
Marked |
National |
Per hopsital employee, per year |
|
Community violence only |
$13.9 Billion |
$2,226 |
|
Marked both, never apportioned |
$3.8 Billion |
$613 |
|
Workplace violence only |
$663.8 Million |
$107 |
|
All violence, the headline |
$18.27 Billion |
$2,947 |
The denominator is the 6.2 million hospital workers AHA's own report uses, so numerator and denominator come from the same document. That figure runs above current federal hospital employment data, which puts it nearer 5.8 million, so every per-employee figure in this article is conservative by roughly 7%. Use the lower denominator and they all rise.
The workplace violence lines in the most authoritative national dataset available come to about $107 per employee per year. For a three-thousand-person hospital that is $321,000. It is not a number that funds a program. It is a number that gets a program declined.
A test worth running on any per-facility figure you are shown
Divide it by that facility's headcount and set it against the two numbers above. All violence, community and workplace together, comes to about $2,947 per employee nationally. The workplace violence lines alone come to $107. A per-facility claim that works out to several times the first number, for workplace violence alone, is not necessarily wrong. But it is doing something the national data does not do, and whoever published it should be able to show you what.
Which is the honest starting point for this whole conversation.
Now look at the same table from the other direction.
Strip out the post-event lines and what remains is money hospitals spend trying to prevent violence. Across the pre-event categories AHA marks as touching workplace violence, and setting aside the portion of the prevention-programs line that funds community violence intervention for injured patients, that is $2.96 billion a year, or about $478 per employee.
The components, in the same unit:
|
What hospitals spend it on |
National |
Per hopsital employee, per year |
|
Violence-related training, all types |
$1.40B |
$226 |
|
Workplace violence prevention programs |
$688.7M |
$111 |
|
Technology to monitor possible events |
$459.0M |
$74 |
|
Security personnel attributable to violence |
$404.3M |
$65 |
|
Policy and procedure development |
$8.6M |
$1 |
|
De-escalation training specifically |
$377.4M |
$61 |
That last line is a subset of the training line rather than an addition to it. AHA priced it by assuming two hours of annual de-escalation training for every patient-facing employee and eight hours for protective services, valued at Bureau of Labor Statistics wage rates. AHA notes its own estimate is conservative because it counts staff time and not vendor fees, which is worth remembering when a training proposal arrives with a price on it. The invoice was never the expensive part. The released time is.
Now put the two halves of the table together, with one caveat stated up front so that we do not commit the error this article is about. Every spending line above is marked as covering community and workplace violence both, so it is not a like-for-like comparison against the workplace-only loss lines. Make it anyway, because the order of magnitude is the point rather than the precision.
American hospitals spend about $226 per employee per year on violence-related training. The workplace violence loss lines in the same table come to $107 per employee. Roughly two to one. Even allowing generously that half the training spend is aimed at community violence, hospitals are spending in the same order of magnitude as the losses AHA is able to model, and quite possibly more.
There are only two ways to read that. Either those loss lines are badly incomplete, which AHA says outright, or a great deal of money is going out without moving the thing it was bought to move.
Both are true. And they lead to the same conclusion, which is the argument of this entire article.
"The question in front of most health systems is not whether to spend on this. They already are. The question is whether what they are already spending is designed to change an outcome or designed to satisfy a survey."
The national data cannot settle that for you. You have to build the number yourself. The rest of this article is how.
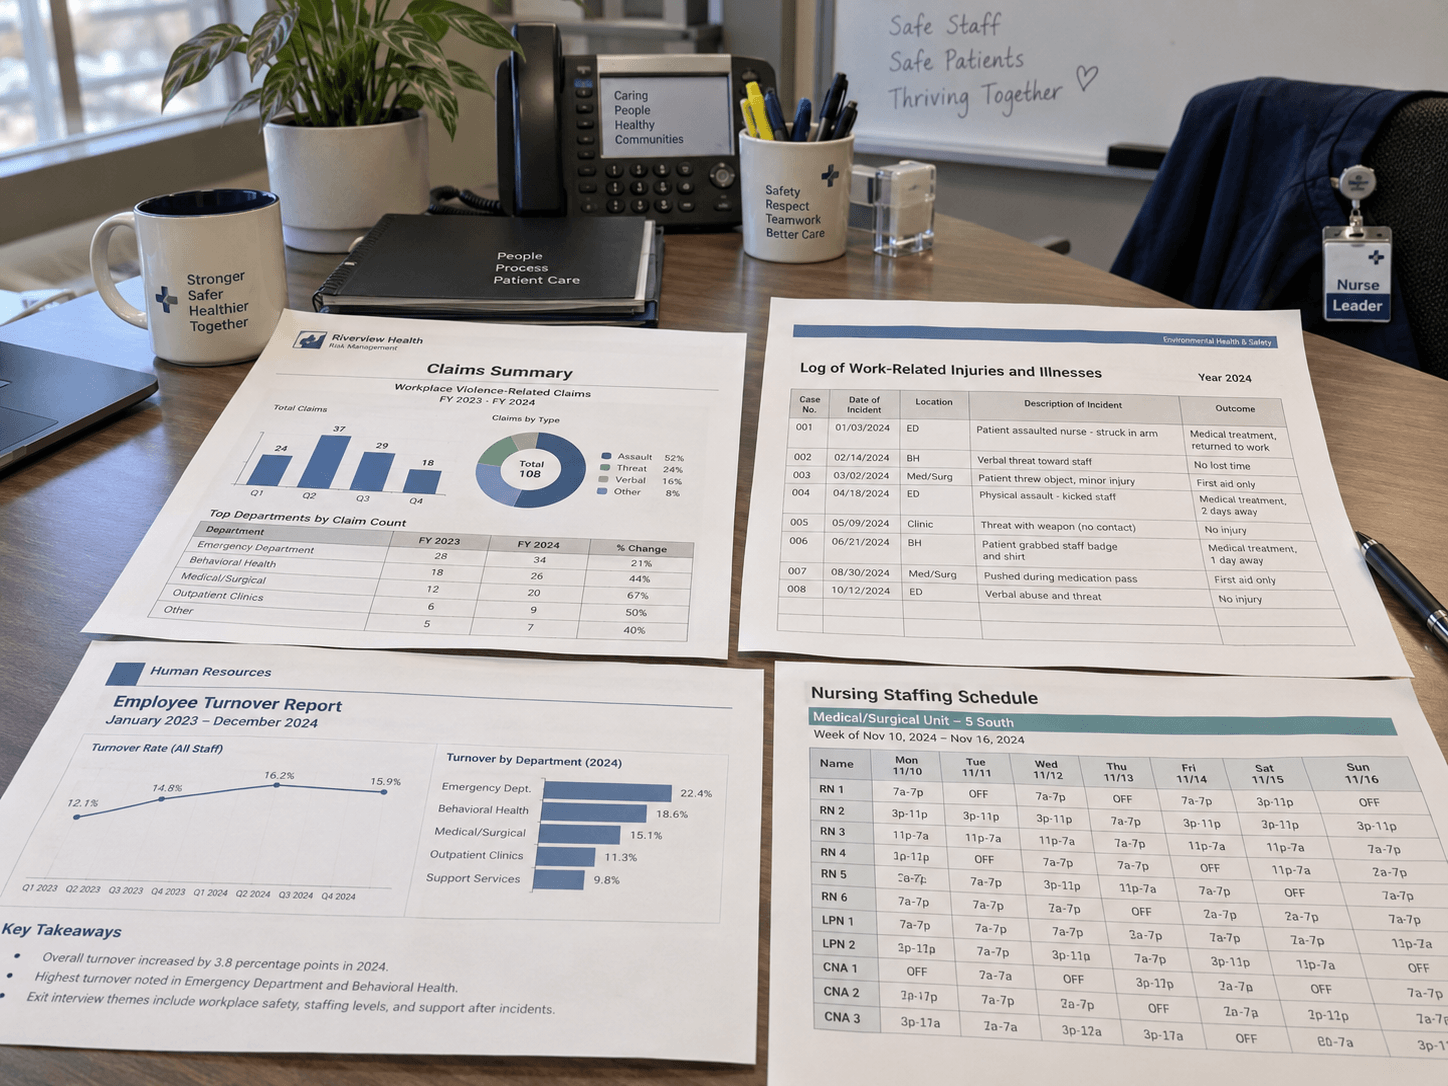
Four documents, four owners, four systems. Almost no hospital has put them on the same page.
Nobody is hiding the cost of workplace violence. It simply does not sit anywhere that a single person can see it.
It lives in four places, and each place has a different owner, a different system, a different reporting cycle, and a different reason to care:
Workers' compensation claims sit with risk management or the third-party administrator, coded by injury type rather than by cause.
Lost and restricted work days sit in the OSHA 300 log with occupational health or safety, counted as days rather than dollars.
Clinical turnover sits with HR and nursing leadership, reported as a rate, with cause captured in an exit interview that is read once and filed.
Secondary and backfill costs sit in the staffing budget with the unit or with finance, where agency premium and overtime appear as line items with no cause attached to them at all.
Four owners, four systems, four vocabularies. In every system I have worked in, no one owned the total. Not because anyone was hiding anything, but because aggregating it is nobody's job, and the person who most needs the sum is the person furthest from all four sources.
Four Streams, One Number
Four owners, four systems, four vocabularies. No one owns the total.
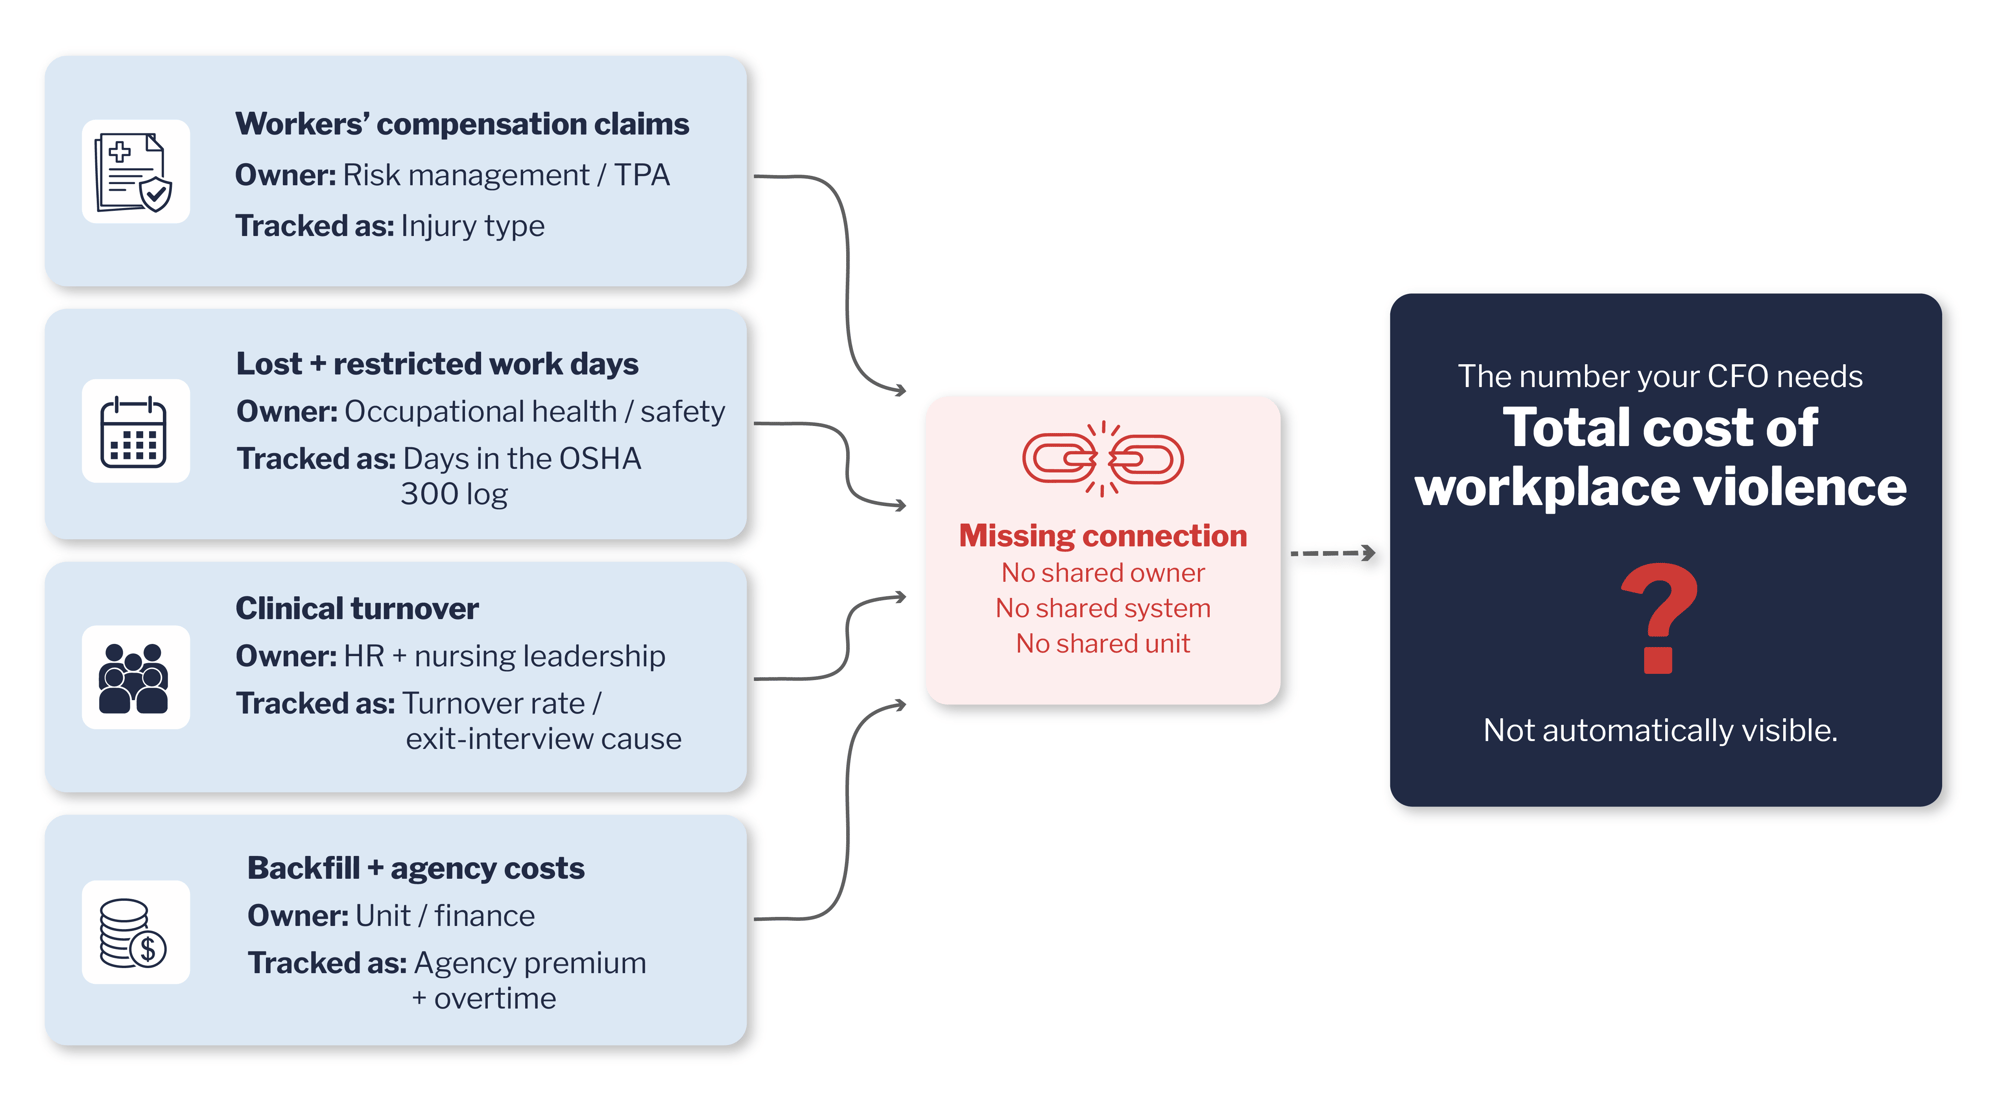
Four owners, four systems, four reporting cycles. The sum is nobody's job, which is why almost no hospital has it.
This is also why the problem is structural rather than analytical. The arithmetic is not hard. The organizational design is the obstacle, and that is a leadership problem, not a spreadsheet problem.
What follows is a worked example with the arithmetic shown and a citation on every input. Substitute your own figures and the method holds.
Take a hospital with 3,000 employees, 1,200 of them registered nurses. Nothing about the method depends on that size, and the result is expressed per employee at the end so you can apply it to yours directly.
Cost Stream 1: Turnover
Start with separations.
1,200 RNs × 17.6% annual RN turnover = 211 RN separations a year. The turnover rate is NSI Nursing Solutions' 2026 report, covering calendar year 2025, drawn from 527 hospitals and 262,405 registered nurses.
The replacement cost is NSI's 2026 figure of $60,090 per staff RN. NSI publishes a dollar amount and not a percentage of salary, which matters because the percentage-of-salary framing that circulates widely in this category cannot be sourced to them.
Now the hard part, which is what share of those separations violence caused. This single assumption decides the entire business case, and nobody knows the answer.
There is exactly one published attribution assumption. AHA and Harborview, building their national estimate, assumed that 3.0% of separations among clinical, healthcare support, and protective services staff are associated with violence, and 1.5% for everyone else. They chose it to be conservative and they say so.
Above that, the ground gets soft fast. National Nurses United reports that 19.2% of surveyed nurses have changed or left a job because of workplace violence, but that is a career-to-date figure across all nurses in a self-selected survey, not a share of any single year's separations. Since a nurse changes jobs several times over a career, it cannot be multiplied by an annual separation count, and anyone who does so is inflating the answer. It tells you the true attribution is probably well above 3.0%. It does not tell you what it is.
And there is a deeper problem underneath both numbers. No published study has followed violence-exposed clinicians into employment records. Dozens link violence to intent to leave. Not one links it to observed departures.
So do what a finance team would do with any input this uncertain. Run it as a sensitivity rather than asserting it.
|
Share of RN separations attributed to violence |
Separations |
Annual turnover cost |
|
3%, AHA and Harborview's published assumption |
6.3 |
$380,700 |
|
10% |
21.1 |
$1,269,100 |
|
20% |
42.2 |
$2,538,200 |
Three rows, one unknown, a factor of nearly seven between the top and the bottom. The uncertainty in your business case is not in the arithmetic. It is in one input, and it is an input you can go and measure.

Building the number for your own hospital
For scale before the arithmetic: on 2023 to 2024 data, hospitals record 18.3 violence-by-others injuries involving days away from work per 10,000 full-time equivalent workers, against 2.6 across all industries. The health care and social assistance sector as a whole sits at 11.9, general medical and surgical hospitals at 14.9, and psychiatric and substance abuse hospitals at 138.8. If your organization runs a behavioral health service line, its numbers are not the same as the rest of the building's and should not be averaged into them.
AHA reports 16,990 hospital workers with violence-related injuries involving days away from work in 2022, plus 8,740 with restricted duty or job transfer, against an estimated 6.2 million hospital workers. Applied to 3,000 employees, that is 8.22 cases with days away and 4.23 with restricted duty.
Now, how to value them. Most models get this wrong in a way that matters.
The instinct is to value the missed days as lost wages. Seven days at a clinical wage looks like the cost of the absence. It is not. When a nurse is injured and off work on a compensable claim, the hospital is generally not paying that nurse's salary. The insurer or the self-insured fund is paying indemnity. Counting the salary as a loss counts money that was never spent.
The two things the organization actually pays are the claim, meaning indemnity plus medical, and the coverage, meaning whoever works the shift instead. Those two do not overlap, so they add.
The claim. NCCI's severity figures give the bracket, and the coding matters:
|
Cause of injury code |
Average total severity per lost-time claim |
|
Struck by fellow worker, patient or other person (code 74) |
$24,378 |
|
Person in act of a crime (code 89) |
$43,100 |
Code 74 is where patient-inflicted injury usually lands, and patient-inflicted injury is most of healthcare workplace violence, so it is the conservative base. 8.22 claims × $24,378 = $200,400. Code the same events as criminal assault and the same 8.22 claims come to $354,300.
Restricted duty: 4.23 cases × $3,000 = $12,700
Coverage: 8.22 × 7 days × 8 hours × $31.77 = $14,600
Stream two: $227,700, and up to $381,600 if the events are coded as criminal assault.
Three caveats, running in both directions. NCCI's severity is drawn across all industries for those cause codes rather than healthcare specifically. Treating every days-away case as one indemnity claim is an approximation. And against those, AHA says its own work-loss estimate "is likely to be an underestimate and does not account for reduced productivity or time loss due to untreated elements of injury, such as psychological harm, work missed due to post-traumatic stress disorder, or unreported injuries." That exclusion list is larger than the thing being measured.
The bracket above is the best published estimate available. Your own number will be better, and getting it is a two-email exercise.
First, though, understand why no clean published figure exists, because it explains something about your own data too.
Workers' compensation has no workplace violence category. The figure you will see quoted, somewhere between $12,000 and $24,000 per claim, is usually attributed to the National Council on Compensation Insurance, the National Safety Council, or both. The National Safety Council attribution is simply wrong: NSC publishes no assault or violence entry in its cost tables at all, which are organized by cause of injury, nature of injury, and part of body. And NCCI, as above, publishes by cause code rather than by assault.
Those cause codes split workplace violence between them, and neither contains it cleanly. Code 74 covers being struck by a co-worker or patient "either on purpose or accidentally," and the example the code definition itself gives is being struck by a patient while lifting or moving them. So it mixes deliberate assault with ordinary clinical contact. It also explicitly excludes anything occurring in the act of a crime, which goes to code 89 at nearly twice the severity.
Which means the recorded cost of a violent event in your organization depends partly on how your claims administrator coded it. A patient who strikes a nurse during a transfer and a visitor who assaults a nurse in the corridor land in different buckets with a $19,000 gap between them, and neither bucket is labeled workplace violence.
So ask your carrier or third-party administrator for your own claims by cause code. You will get a defensible figure to replace the estimate above, and you will find out whether your coding is telling you the truth about what is happening on your units. Both are worth the email.
Start by noting what is already counted, because this is where double counting creeps in. NSI's $60,090 is a fully loaded cost of turnover. It includes advertising, recruiting, onboarding, orientation, and the productivity ramp of a new hire. All of that is in stream one already.
What it does not include is paying premium rates to cover the shifts while the post is empty. NSI publishes that separately, which is exactly why it is a distinct stream rather than a double count.
This is the stream that gets left out most often, and it is the one that scales worst.
Start by noting what is already counted, because this is where double counting creeps in. NSI's $60,090 is a fully loaded cost of turnover. It includes advertising, recruiting, onboarding, orientation, and the productivity ramp of a new hire. All of that is in stream one already.
What it does not include is paying premium rates to cover the shifts while the post is empty. NSI publishes that separately, which is exactly why it is a distinct stream rather than a double count.
The arithmetic:
- NSI puts a travel RN at $91.23 an hour against $59.46 for an employed staff RN including benefits. A premium of $31.77 an hour, which over a 2,080-hour year is $66,081 per position. An independent industry benchmarking survey put the 2025 average travel nurse bill rate at $90.54, within one percent, which is unusually good corroboration for a staffing figure.
- NSI puts the time to fill an RN vacancy at 78 days, which is 21% of a year.
- At a 3% attribution, 6.34 violence-attributed vacancies × 78 days = 1.35 FTE-years of vacancy. At $66,081, that is $89,500.
At a 10% attribution it is $298,200. At 20%, $596,500.
One caution: this assumes every vacant shift is covered with travel staff, and real hospitals use a mix of travel, per diem, overtime, and simply running short. Treat this stream as an upper bound, and replace it with what your staffing office spent, which they can tell you in an afternoon. Running short, incidentally, is not free either. It just moves the cost somewhere nobody is measuring.
What it adds to, and what it does not
Four Streams, One Unknown
Dollars per hospital employee, per year, at three assumptions for violence-attributed turnover
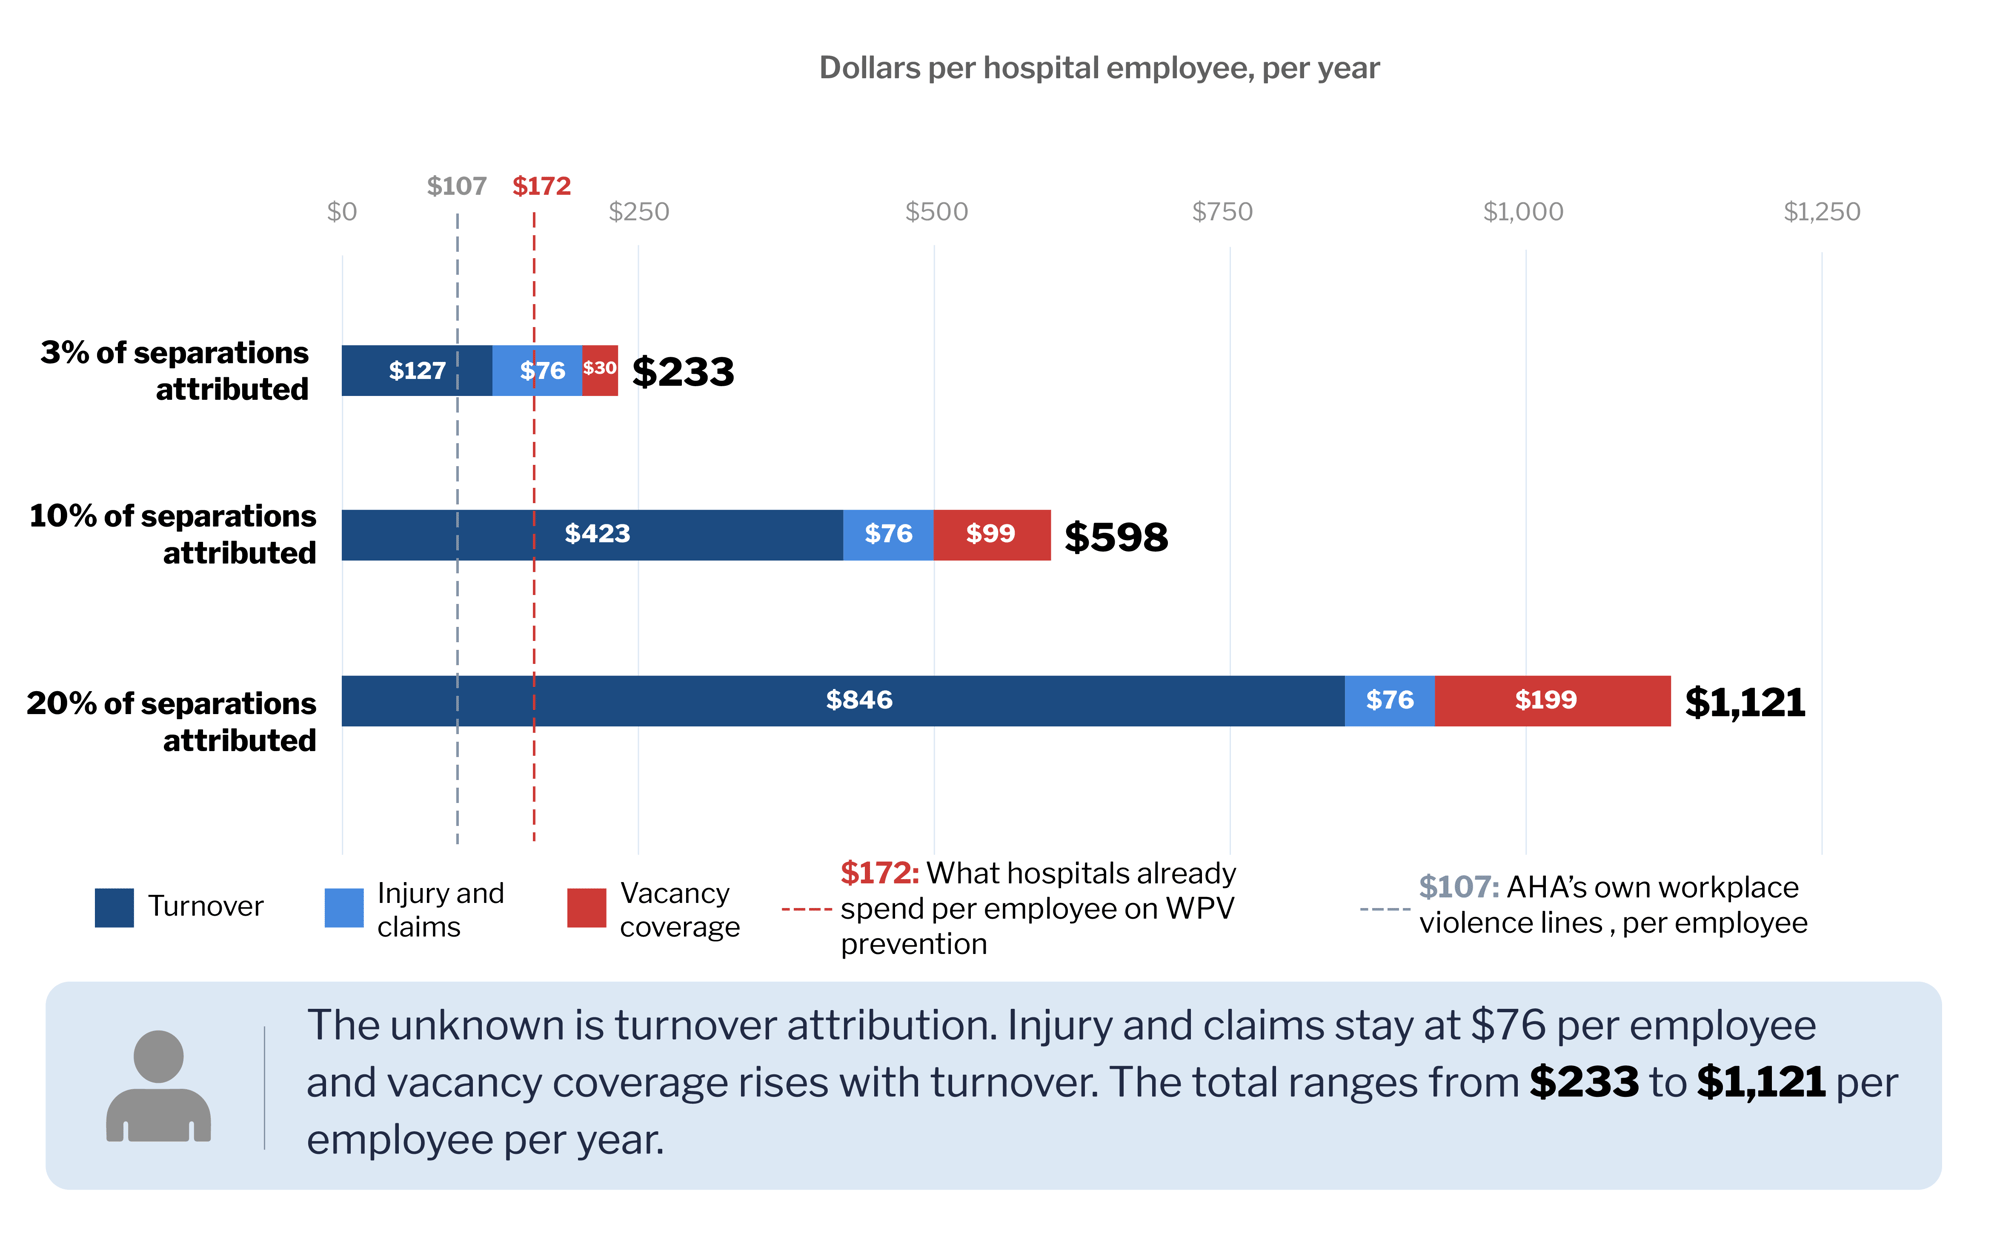
Everything on this chart is arithmetic except one number, and that number is sitting in your exit interviews.
| Cost Stream |
3% Attributed |
10% Attributed |
20 % Attributed |
|
1. Clinical turnover |
$380,700 |
$1,269,100 |
$2,538,200 |
|
2. Claims, restricted duty, and shift coverage |
$227,700 |
$227,700 |
$227,700 |
|
3. Replace stream 2 with your own claims data |
|
|
|
|
4. Covering the vacancy |
$89,500 |
$298,200 |
$596,500 |
|
Total annual cost |
$697,900 |
$1,795,100 |
$3,362,400 |
|
Per employee, per year |
$233 |
$598 |
$1,121 |
That last row is the one to carry out of this article.
Multiply it by your own headcount and you have skipped the entire worked example.
The assumptions, in one place
Every number above rests on a stated assumption. None is hidden, and each can be replaced with your own figure.
- RN turnover 17.6% and replacement cost $60,090. NSI Nursing Solutions 2026, calendar year 2025, 527 hospitals.
- Violence-attributed share of separations: unknown. Shown at 3%, 10%, and 20%. Only the 3% is published, by AHA and Harborview, and they chose it to be conservative.
- Injury rates: 8.2 days-away cases and 4.2 restricted-duty cases per 3,000 employees. Scaled from AHA's 2022 hospital counts.
- Claim severity $24,378 per lost-time claim. NCCI accident years 2021 to 2022, cause code 74, indemnity and medical combined, all industries. Code the same events as criminal assault and it rises to $43,100.
- One days-away case treated as one indemnity claim. An approximation.
- Lost wages are not counted as a separate loss, because on a compensable claim the employer is not paying them. Counting both wages and indemnity would double count.
- Restricted duty valued at $3,000 per case. AHA's own assumption.
- Shift coverage and vacancy coverage at $31.77 per hour, or $66,100 per position per year. NSI's measured travel-versus-employed differential. Assumes full travel coverage, which makes stream four an upper bound.
- Time to fill a vacancy: 78 days. NSI 2026.
- Seven days away per injury and an eight-hour day. Seven is the published median for intentional-injury cases. Eight hours is a convention; twelve-hour shifts change it.
- A 2,080-hour work year, used to convert the hourly staffing premium to an annual one.
- Rounding. Figures are rounded for display and totals are computed from unrounded values, so a column may differ from the sum of its printed parts by a few hundred dollars.
- Excluded entirely: litigation, insurance premium effects, psychological injury, reputational cost, and every incident that was never reported.
The build also produces a useful check on itself. AHA's own workplace violence lines came to $107 per employee, top-down from national data. This build, at AHA's own conservative attribution assumption, comes to $233, bottom-up from one hospital's operations. Roughly a factor of two apart, in the direction you would predict: AHA's work-loss line is a single narrow measure that AHA itself calls an underestimate, while this build counts claims, coverage, and turnover. Two independent routes, same order of magnitude. At a 20% attribution the bottom-up figure is ten times the national one, which tells you the attribution assumption, not the method, is where the argument lives.
Note what this is not. It is not a national average scaled to your size. It is not a vendor's model. It is four numbers your organization already owns, multiplied by published benchmarks, with the arithmetic and the assumptions in the open. Every input above can be replaced with your own actual figure, and every replacement makes it stronger.
The spread is not a measurement problem. It is a single unresolved input, and one stream carries almost all of it.
The difference between $233 and $1,121 per employee is one number: the share of clinical separations that violence caused. That number is not in AHA. It is not in NSI. It is not in the Bureau of Labor Statistics. It is in your exit interviews, and it is almost certainly not coded.
Every health system I have worked in asks departing clinical staff why they are leaving. Most capture the answer as free text. Almost none code it against a violence category, which means the single most valuable data point in the entire business case is collected, stored, and never used.
Fixing that costs nothing and takes one conversation with HR. Add a coded field. Review it quarterly. Within four quarters you have your own attribution rate, and at that point you are no longer arguing from a national estimate. You are arguing from your own payroll.
This is the point in the conversation where the budget stops being a debate about somebody else's research.
"The most valuable number in your business case is already being collected by your own organization and thrown away."
Everything above rests on recorded events, which means everything above is a floor.
The claim that circulates here is that fifty to seventy percent of healthcare workplace violence goes unreported. That range is not published anywhere. The nearest published statement is a 2019 American Nurses Association issue brief noting that research "has variously found that only 20 to 60 percent of nurses report incidents of violence," which describes non-reporting of 40 to 80 percent. How that became fifty to seventy is anyone's guess.
What is published is more useful, and more interesting.

Almost half of nurses who experience an incident do not report it, and the reason they give is that nothing changes.
The strongest study is Arnetz and colleagues in 2015, which matched what hospital staff said had happened to them against what the incident system actually recorded. Of 275 employees who reported experiencing a violent event in the prior year, 88% had no corresponding record in the electronic incident reporting system, and 48% had not reported the event through any channel at all.
Those two numbers are both correct and they mean different things, which is exactly why this gets quoted badly. The 88% describes the formal system. The 48% describes whether anyone was told. A great deal of violence in hospitals is known to supervisors and colleagues and invisible to the organization.
More recent data says the same thing from the other direction. In a 2026 survey of 2,090 nurses, of the 1,204 who had experienced an incident, 54% reported it formally and 46% did not. The leading reason given for not reporting was that they did not believe anything would change. Of those who did report, 40% saw no action taken and 9% felt supported by leadership.
What Happens After a Report
Of every 100 staff who experience an incident
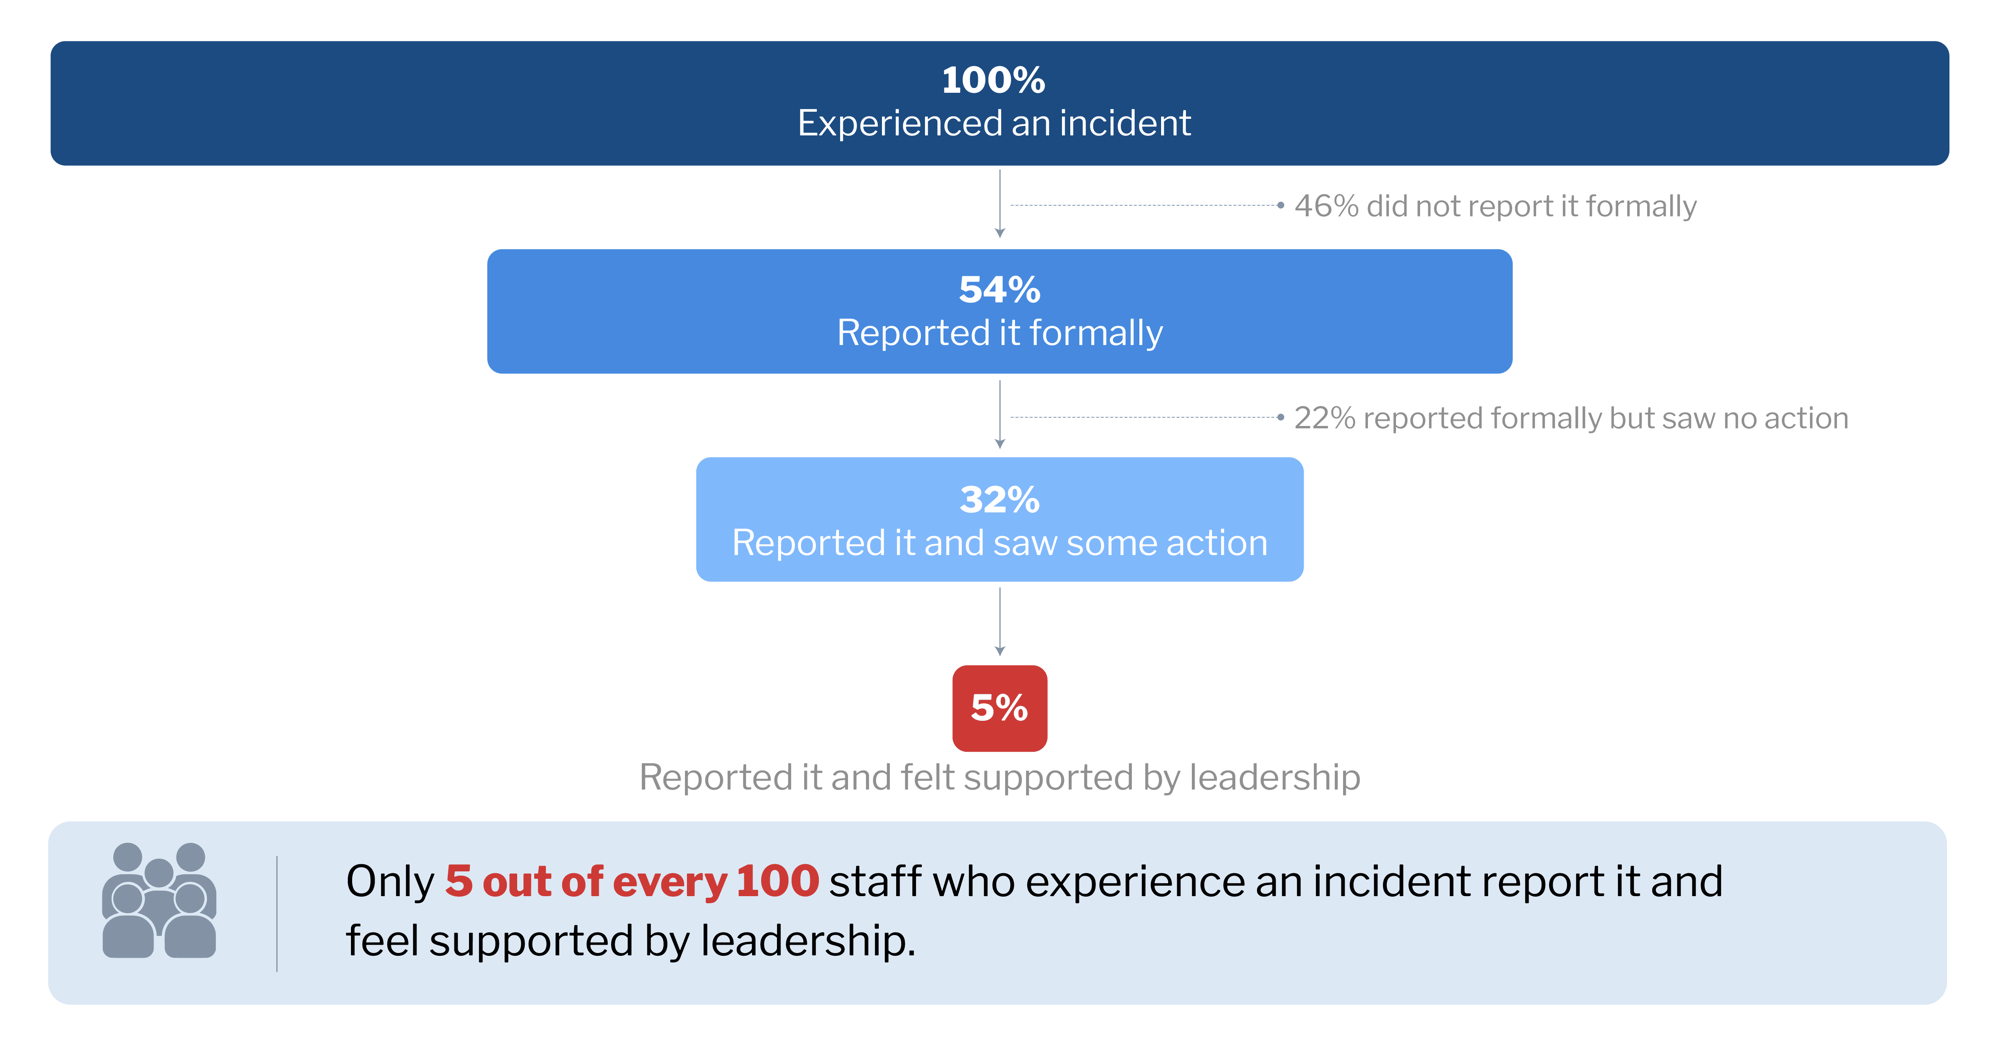
Reporting rates are not a measure of how much violence occurs. They are a measure of what staff have learned to expect from reporting it.
Read those together and the reporting rate stops looking like a data problem. It is a rational response to observed organizational behavior. Staff are not failing to report. They are declining to spend twenty minutes on a form that has historically produced nothing.
Two consequences follow, and the second one is the one that gets missed.
First, every cost figure you build is conservative by an unknown but large margin, and you should say so when you present it rather than waiting to be asked.
Second, fixing the reporting system without fixing the response is worse than doing nothing. A 2023 study found that a strong violence-reporting culture was associated with a stronger relationship between violence and burnout, not a weaker one. That is the same finding as the 9%, arrived at independently: asking people to report into a system that does not respond teaches them something about the organization that they did not previously know.
Which means the first move in a workplace violence program is not a reporting campaign. It is deciding, in advance and in writing, what happens after a report.
Everyone in this category quantifies the problem. Almost nobody compares it to what a program costs, which makes every one of those quantifications unusable for the decision it was supposedly built for.
So here is the comparison, using AHA's own spending figures rather than anyone's price list.
Earlier we counted five pre-event spending lines totaling about $478 per employee a year. Two of those five are the ones closest to an actual workplace violence prevention program: the prevention-program line itself at $111 and de-escalation training at $61. Call it $172 per employee per year, and note that it is a subset of the $478, not an addition to it.
Both sides of the comparison are now in the same unit, so it reduces to one small table:
| Cost Stream |
3% Attributed |
10% Attributed |
20 % Attributed |
|
Cost of violence, per employee |
$233 |
$598 |
$1,121 |
|
Prevention spend at the national rate, per employee |
$172 |
$172 |
$172 |
|
Reduction required to break even |
74% |
29% |
15% |
Read the first column carefully, because it is the least flattering one.
At AHA's own most conservative attribution assumption, a program costing what the sector already spends has to cut identifiable costs by nearly three quarters to pay for itself. That is more than the best trial in this field demonstrated. Move to a 10% attribution and it needs 29%, which is comfortably below what the strongest trial in this field achieved. At 20% it needs 15%.
So the sector's average spending level is defensible at a realistic attribution and hard to defend at the most conservative one.
There are three explanations, and every one of them is worth knowing.
Explanation One:
The 3% assumption is too low.
Explanation Two:
The cost streams are still incomplete
Explanation Three:
The money is not producing a return.
All three lead to the same action. Measure your own. And notice what the table has already told you, which is that for most hospitals the decision on the table was never whether to spend this money. They are spending it. The decision is whether to keep spending it the way they are.
Run the same arithmetic against an actual price
One caution about that table before you use it. The $172 is the sector average, not a quote. It is what hospitals as a group already spend. The number that decides an actual purchase is the price per employee per year of the specific program in front of you, and it may be a fraction of the average or a multiple of it.
So run the last row yourself. Take the price, divide by your headcount if it is not already expressed that way, and set it against your own cost per employee. The reduction required to break even is simply the program's cost per employee divided by yours. A program at $50 per employee, set against our example hospital's most conservative figure of $233, breaks even at a 21% reduction. Set against the $598 figure that a 10% attribution produces, it breaks even at 8%. The arithmetic is one division and it does not require anyone's permission.
Two things to insist on when you do it.
Ask every vendor for a price per employee per year.
Separate one-time onboarding from the recurring rate.
"At the most conservative assumption available, hospitals are already spending about as much on preventing workplace violence as they can prove it costs them. That is not an argument for spending less. It is an argument for finding out."
The number we are not going to give you
At this point in a vendor article you would normally get four percentages. A workers' compensation reduction, a lost-day reduction, a turnover reduction, and a payback period.
We are not going to publish those, and the reason is worth stating plainly.
There is no published cost-effectiveness, cost-benefit, or cost-utility analysis of a healthcare workplace violence prevention program. Not of ours and not of anyone else's. A systematic review of violence-prevention economic evaluations covering two decades and 28 studies does not include occupational violence at all. AHA concedes the same gap in its own limitations, noting it was unable to estimate the cost savings prevention programs may create.
The effectiveness evidence is thin in the same direction. A 2020 Cochrane review of organizational interventions to prevent violence against healthcare workers found very low to low certainty evidence, with multicomponent interventions showing no clear effect. A companion review found that education combined with training may not reduce aggression toward healthcare workers, though it may improve knowledge and attitudes.
In a field with that much evidentiary vacuum, four precise percentages from the company selling the program are the least credible thing that could appear on this page.
What does exist is one strong trial, and it is more useful to a CFO than any ROI figure would be.
In a 2017 randomized controlled trial across 41 hospital units, units randomized to the intervention had roughly half the rate of violent events of control units at six months, and roughly 60% lower violence-related injury rates at 24 months. Read that carefully, because the mechanism matters. Violence was rising across the whole system during the study. The control units got worse. The intervention units held roughly steady. What the trial demonstrates is prevented deterioration rather than absolute reduction, which is both less flattering and more relevant to what most organizations are facing.
The intervention was not a curriculum. Each unit's supervisor received that unit's own violence data benchmarked against the rest of the hospital, and then built an action plan with staff. The core of it was a 45-minute walkthrough using data the hospital already had.
Sit with that, because it cuts against our own commercial interest and it is still the most important finding in this literature. The highest-evidence intervention in the field costs almost nothing and consists of giving unit leaders their own numbers and making them responsible for a plan. What it requires is management attention, not procurement.
"The best-evidenced intervention in this field was 45 minutes of a supervisor's time and data the hospital already owned."
That is not an argument against training. It is an argument about what training has to be attached to in order to matter, and it is why we say that buying training and calling it a program is the most common and most expensive mistake in this category.
Two organizations can run the same curriculum, hit the same completion percentage, produce the same binder for the same surveyor, and get opposite results. The difference is not the content. It is everything the organization does around it.
A compliance program asks whether the training happened. A culture asks whether anything changed, and it answers that question through what leadership funds, governs, and holds people accountable for.
This is measurable in a way that surprises people. A cross-sectional study of 3,132 hospital staff with patient contact at one academic medical center found that higher patient safety culture was associated with substantially lower odds of workplace violence, with teamwork across units and quality of handoffs among the strongest individual contributors. It is a single site and an association rather than a demonstrated cause. But the organizational conditions associated with fewer clinical errors are the same ones associated with less violence, and that is not usually how either problem is budgeted.
Culture also shows up in mechanisms nobody thinks of as safety mechanisms. A rounding survey that asks whether staff were "courteous and responsive," with no field for what actually happened in that interaction, is quietly working against staff safety while everyone involved has good intentions. Staff safety is a prerequisite for patient safety rather than a competing priority, and an organization that treats them as competing has already told its own people where they rank.
The principle underneath
Vistelar's entire system rests on one foundational principle: treat people with dignity by showing them respect. It sits underneath all six phases of the 6 C's of Conflict Management rather than inside any one of them.
In a cost conversation, that line does more work than it looks like it does. It is not a values poster. It is the mechanism. A patient who feels respected, heard, and given a real explanation, treated as a person having a bad day rather than a problem to be managed, de-escalates on their own far more often than one who feels handled. Every avoided escalation is an event that never enters any of the four cost streams.
The principle contains a distinction that makes it usable under pressure: showing respect does not require respecting. Respect is earned and rests on your values. Showing respect is a professional behavior you perform regardless, because it works. That is what makes it available to a nurse in hour eleven of a twelve-hour shift dealing with someone who has just insulted her.
These are learnable, trainable behaviors rather than personality traits, which is exactly why they belong in a curriculum and not only in a leadership talk track. The skills themselves are Pillar 1 territory. If you want the operational side, start with the skills your staff need.
The obligation does not stop at the main campus
The same obligation, and the same exposure, extends to every place your name is on the door.
Urgent care centers with two staff and no dedicated security officer. Medical office buildings where a billing specialist handles an angry patient at the front desk with no duress system and no escalation pathway. Freestanding emergency departments. Standalone behavioral health clinics. Usually the same risk with less infrastructure, and almost always excluded from the program that was designed for the main campus.
"A safety culture that stops at the hospital entrance is not a safety culture. It is a policy with a geographic limit."
Every one of those sites generates workers' compensation claims, lost days, and turnover that land in the same four cost streams. They are simply harder to see, which means the number you build without them is lower than the number you actually have.
Workplace violence prevention has outgrown the safety committee.
A standing item at the end of an environment-of-care meeting does not have the standing, the cross-functional membership, or the cadence to own this. In my experience infrastructure without governance fades within twelve to eighteen months of rollout, which is almost exactly when the next budget cycle asks what the last one bought.
The principles that keep it from fading are not complicated, and three of them do most of the work.
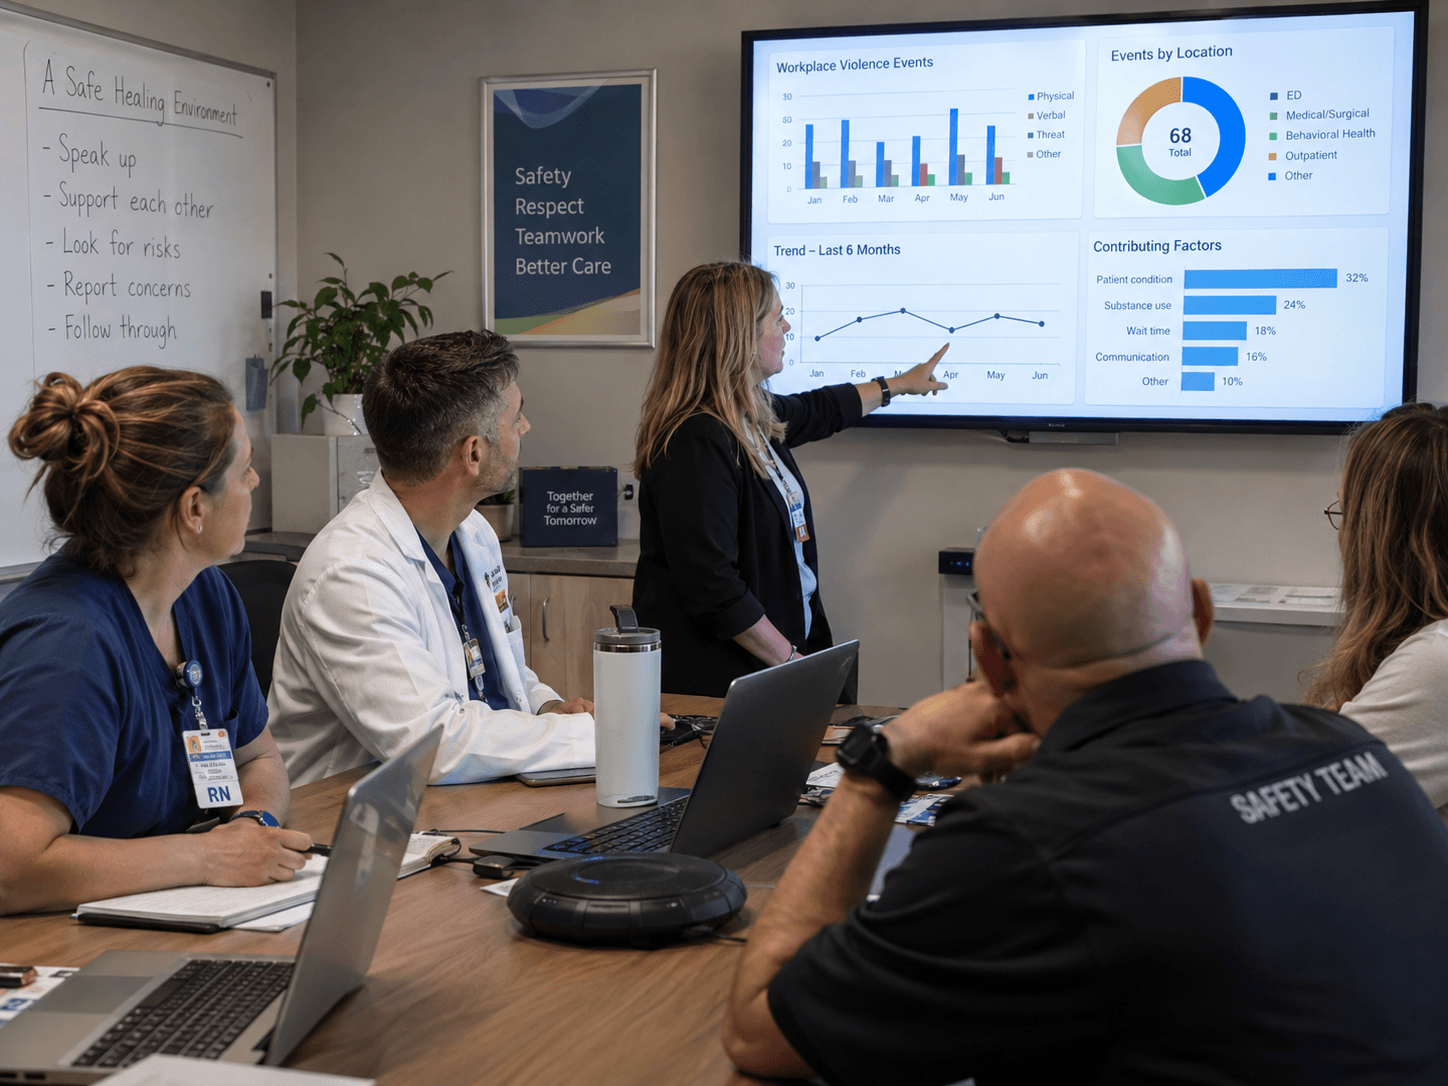
In the strongest trial in this field, what moved the numbers was each unit owning its own data.
Ownership has to be senior enough to move money.
The agenda opens with the fiscal number rather than a status report.
Membership has to include the four owners of the four cost streams.
Standardization without ownership is a wall poster. Ownership without standardization is a meeting. You need both, and the payoff for getting both right is a program that becomes the culture instead of the binder.
We took the measurement argument seriously enough to apply it to ourselves.
Vistelar contracted with the University of Wisconsin–Milwaukee to evaluate our program at Milwaukee County Behavioral Health Division and to follow the results for two years. The study was jointly funded by the county and by Vistelar, and we did not conduct it or control its findings. A summary of the methods and results was published in the Journal of Healthcare Protection Management under the title "An evaluation of an all-staff violence-reduction training program."
The results were positive overall. The finding that changed our business was less comfortable: conflict management skills improved a month after training and had declined by the end of two years.
That result, along with feedback from customers, is why we moved away from a traditional training model built on a packaged curriculum, train-the-trainer delivery, and a workbook purchase requirement, toward content licensing with a flexible curriculum, digital courseware, a partnership relationship, and an explicit focus on sustainment.
The relevance to a cost conversation is direct. If capability decays, then a one-time training expenditure is not an investment. It is a subscription you forgot to renew, and the second-year numbers will tell you so.
"We commissioned a study, it told us something we did not want to hear, and we changed the business because of it."
"Firmer limits will hurt our patient experience scores"
This is the most common executive objection to a serious workplace violence program, and it deserves a straight answer.
There is no published evidence that setting clearer behavioral expectations with patients and visitors harms patient experience scores. There is also no published evidence that it helps them. Many large systems have adopted patient codes of conduct and not one has published an evaluation of the effect on their scores. The objection is a hypothesis that has never been tested.
What has been tested is adjacent and points the other way. A longitudinal study of US hospitals compared changes in nurse staffing, skill mix, education, and work environment against changes in patient experience scores. Change in the work environment had the strongest association with score improvement of any of them, and the authors describe improving the work environment as an effective investment strategy for hospitals with limited resources.
Staff safety is part of the work environment. Related work also links violence exposure to increased medication errors, patient falls, and delayed medication administration, and links violence exposure through emotional exhaustion to lower perceived patient safety.
So the evidence does not support the fear. What it does support is the opposite concern: that violence exposure is already degrading the clinical experience your scores are measuring, and that nobody is attributing it.
"We already have a zero-tolerance policy"
The field is genuinely split on this, and the split is the most useful thing to know about it.
The Emergency Nurses Association endorses it directly, stating that mitigating workplace violence "requires a zero-tolerance environment instituted and supported by healthcare organizations and leadership." The American Association of Critical-Care Nurses uses the term too, though it scopes it to bullying, verbal abuse, and other institutional violence rather than to patient and visitor assault, and carries a separate statement on staff-to-staff incivility. The American Nurses Association, in its position statement effective March 2025, states that a zero-tolerance policy "may not be appropriate" and that if one is instituted, an explanation of what it entails should be included. The Joint Commission's workplace violence requirements do not use the term at all, and instead require leadership oversight, worksite analysis, a reporting and tracking system, education, and an annual program evaluation.
Meanwhile, no published study has evaluated whether zero-tolerance policies in healthcare reduce violent events, injuries, or turnover. The critical literature is more developed than the supportive literature. A study of 99 managers and staff across a regional health service found that staff rarely enact zero-tolerance policies at all, because "we cannot refuse to treat," and concluded that such policies combined with incongruent legislation impair staff decision-making rather than enhance safety. An earlier critique noted that zero-tolerance policies typically carve out patients whose aggression stems from a medical or psychiatric condition, which is most of what happens in an emergency department or an inpatient unit, so the policy excludes the majority of the events it appears to cover.
The direction of travel is clear enough. The field's own consensus is drifting from a slogan toward an auditable management system, and the accreditor has already made that move. If your program's centerpiece is a zero-tolerance statement, you have a policy rather than a program, and the difference will show up in the four cost streams long before it shows up in a survey.
The arithmetic above is the easy part. I want to be straight about which part is not.
An article can give you a method, a set of published inputs, and every assumption named. What it cannot do is get four department heads to hand data to someone who does not report to them. It cannot sit in the room when the CFO asks the second question. And it cannot keep the measurement running four quarters later, when the person who cared about it has moved on and the reporting has quietly reverted to a completion percentage.
Those are not analytical problems. They are the same organizational problem this article opened with: the cost is spread across four owners and the sum is nobody's job.
Building the number once is an afternoon's work. Building an organization that keeps it current is the actual project. That is why the governance section is in here at all, and it is the part nobody can do for you from the outside.
The bottom line
The business case for workplace violence prevention is not weak. It is unbuilt.
The national figure everyone reaches for measures something else. The per-claim benchmark everyone quotes does not exist. The effect sizes that circulate in this category cannot be sourced. And the one number that would settle the whole question for your organization is being collected in your exit interviews and thrown away.
None of that is a reason to wait. It is a description of a decision that is currently being made on borrowed evidence when it could be made on your own.
Four numbers. Four owners. One afternoon to put them in the same spreadsheet. At the end of it you will have a figure that survives being taken apart, which is the only kind that ever gets funded.
"A number your CFO can take apart is worth more than a bigger number they can only take on faith."
If you want to work through it against your own figures, our workplace violence cost and ROI calculator is ungated, shows its formula, and lets you set your own reduction assumptions rather than accepting ours. And if you would rather have the conversation with someone who has built these cases from the inside, that is what a discovery call is for.


Frequently Asked Questions
What does workplace violence cost a hospital?
Less than the most-cited national figure implies, and more than any organization can currently document. The American Hospital Association's widely quoted $18.27 billion covers workplace and community violence, and by AHA's own classification 75.6% of it is marked community violence only, including the $13.17 billion largest line, which is uncompensated care for violence victims who arrive as patients. The lines marked workplace violence only come to $663.8 million nationally, or about $107 per hospital employee per year. Because reported events substantially understate actual events, every figure derived from recorded data is a floor. Built from the bottom up across all four cost streams, a hospital with 3,000 employees carries somewhere between $233 and $1,121 per employee per year depending on how much of its clinical turnover is violence-attributed, and that figure still excludes litigation, insurance premium effects, psychological injury, and every incident nobody reported. The only defensible number for a specific hospital is one built from that hospital's own workers' compensation, injury, turnover, and staffing data.
Is the $18.27 billion figure the cost of workplace violence to hospitals?
No. It is the cost of workplace and community violence combined. AHA's Table 1 marks each cost line by location of violence. $13.80 billion is marked community only, $663.8 million is marked workplace only, and $3.80 billion is marked as both and is never split between them. The report is careful and its title says so; the citation habit that surrounds it is not.
What data does a hospital need to build a workplace violence cost case?
Four streams that already exist in four different systems: workers' compensation claims coded by cause, days away and restricted duty from the OSHA 300 log, clinical turnover with a violence attribution applied, and agency and overtime backfill. The hardest input is the violence attribution on turnover, and the fastest way to get it is to add a coded field to the exit interview and review it quarterly.
What percentage of nurse turnover is attributable to workplace violence?
Nobody knows. The only published assumption is AHA and Harborview's 3.0% of separations for clinical, healthcare support, and protective services staff, chosen to be conservative. National Nurses United reports that 19.2% of surveyed nurses have changed or left a job because of workplace violence, but that is a career-to-date figure across all nurses rather than a share of any one year's separations, so it cannot be multiplied by an annual separation count. It suggests the true rate is well above 3.0% without saying what it is. No published study has followed violence-exposed clinicians into employment records. For a 3,000-employee hospital, the difference between a 3% and a 20% assumption is roughly $233 against $1,121 per employee per year, which is why this is worth measuring locally rather than borrowing.
How much does it cost to replace a nurse?
NSI Nursing Solutions puts the cost of turnover for a staff registered nurse at $60,090 in its 2026 report, covering calendar year 2025. NSI publishes a dollar figure and not a percentage of salary, so replacement costs expressed as a multiple of pay should not be attributed to them. NSI also reports that each one percent change in RN turnover costs or saves the average hospital about $295,000 a year.
What is the average workers' compensation cost of a workplace violence claim in healthcare?
No published figure exists for workplace violence as a category, because workers' compensation does not have that category. The National Safety Council's cost tables contain no assault or violence entry at all, so any figure attributed to NSC is misattributed. NCCI publishes severity by cause of injury, and workplace violence splits across two codes: "struck by fellow worker, patient or other person" at $24,378 average total severity per lost-time claim, which also captures accidental contact such as being struck by a patient during a transfer, and "person in act of a crime" at $43,100, which is where criminal assaults land. Both are accident years 2021 to 2022. The commonly quoted $12,000 to $24,000 band sits at or below the bottom of that bracket. The reliable route is to ask your carrier or third-party administrator for your own claims by cause code.
What percentage of workplace violence incidents go unreported in healthcare?
The commonly quoted "50 to 70 percent" is not published anywhere. The strongest study matched staff self-reports against hospital incident records and found 88% of self-reported events had no electronic incident report and 48% were not reported through any channel. A 2026 survey of nurses found 46% of those who experienced an incident did not report it, with the leading reason being that they did not expect anything to change. Those two figures are not interchangeable. The 88% describes the formal incident system; the 46% and the 48% describe whether the event was reported to anyone at all. State which one you mean.
What is the ROI of workplace violence prevention in healthcare?
No published cost-effectiveness, cost-benefit, or cost-utility analysis of a healthcare workplace violence prevention program exists, for any provider including us. What exists is effectiveness evidence. A 2017 randomized controlled trial across 41 hospital units found roughly 50% lower violent event rates at six months and roughly 60% lower violence-related injury rates at 24 months, relative to control units, from an intervention consisting of giving each unit its own violence data and having its supervisor build an action plan. Violence rose across the whole system during the study, so the finding is prevented deterioration rather than absolute reduction. The practical way to evaluate the investment is to build your own cost figure, state the reduction you would need to break even, and decide whether that reduction is plausible for your organization.
Do zero-tolerance policies reduce workplace violence?
No study has tested whether they do. Professional bodies are split. The Emergency Nurses Association endorses zero tolerance directly. AACN uses the term but scopes it to bullying, verbal abuse, and other institutional violence rather than to patient and visitor assault. The American Nurses Association's 2025 position statement says such a policy may not be appropriate. The Joint Commission does not use the term and instead requires leadership oversight, worksite analysis, reporting and tracking, education, and annual program evaluation. The main published critique is that staff rarely enact these policies because they cannot refuse to treat, and that the policies typically exempt aggression arising from medical or psychiatric conditions, which is most of what actually occurs.
Will a stricter approach to patient behavior hurt our HCAHPS scores?
There is no published evidence in either direction, because no one has evaluated it. The adjacent evidence points the other way: in a longitudinal study of US hospitals, change in the nurse work environment had a stronger association with patient experience improvement than staffing, skill mix, or nurse education. Violence exposure has separately been linked to increased medication errors, patient falls, and delayed medication administration.
Sources
Cost and economic data
- American Hospital Association and University of Washington Harborview Injury Prevention and Research Center. The Burden of Violence to U.S. Hospitals: A Comprehensive Assessment of Financial Costs and Other Impacts of Workplace and Community Violence. March 2025 (released June 2025). Table 1 and Sections 3.1, 4.1, 4.2, 4.4.3, and 6.
- American Hospital Association. Fast Facts on U.S. Hospitals, 2026. February 2026, from the 2024 AHA Annual Survey.
- NSI Nursing Solutions. 2026 National Health Care Retention and RN Staffing Report. January 2026, covering calendar year 2025; 527 hospitals, 262,405 registered nurses.
- Bureau of Labor Statistics, Occupational Employment and Wage Statistics, May 2025 (released May 2026).
- Bureau of Labor Statistics, Workplace Violence 2021–2022 fact sheet (October 2024).
- NCCI. Workplace Violence: Part 1, Assault Trends, Drivers, and Demographics (April 2026), Figures 6 and 7, accident years 2021–22; and Part 3, Assaults and Violence by Others in Finer Detail (July 2026), Table 1.
- Workers Compensation Insurance Organizations, Injury Description Table, cause of injury codes 74 and 89.
- National Safety Council, Injury Facts, workers' compensation costs and assault at work.
- Staffing Industry Analysts and NATHO, Travel Nurse Benchmarking Survey, 2026.
Reporting and prevalence
- Arnetz JE, Hamblin L, Ager J, et al. "Underreporting of Workplace Violence: Comparison of Self-Report and Actual Documentation of Hospital Incidents." Workplace Health & Safety. 2015;63(5):200–210.
- Nurse.org 2026 nursing workplace violence survey (n=2,090, self-selected online sample).
- National Nurses United. Workplace Violence Report, February 2024 (n=914 registered nurses, calendar year 2023). This is the source of the 19.2% figure; it does not appear in the 2025–2026 edition.
- National Nurses United. The State of Workplace Violence in Health Care in 2025–2026, June 2026 (n=1,267 registered nurses).
- American Nurses Association. Reporting Incidents of Workplace Violence issue brief, 2019.
- Kim S, Lynn MR, Baernholdt M, et al. "How does workplace violence-reporting culture affect workplace violence, nurse burnout, and patient safety?" Journal of Nursing Care Quality. 2023;38(1):11–18.
Effectiveness and evidence gaps
- Arnetz JE, Hamblin L, Russell J, et al. "Preventing Patient-to-Worker Violence in Hospitals: Outcome of a Randomized Controlled Intervention." Journal of Occupational and Environmental Medicine. 2017;59(1):18–27.
- Peterson C, Kearns MC. "Systematic Review of Violence Prevention Economic Evaluations, 2000–2019." American Journal of Preventive Medicine. 2021;60(4):552–562.
- Geoffrion S, et al. Cochrane Database of Systematic Reviews. 2020;9:CD011860.
- Spelten E, et al. Cochrane Database of Systematic Reviews. 2020;4:CD012662.
Culture, patient experience, and policy
- Rosenbaum KEF, Lasater KB, McHugh MD, Lake ET. "Changes in Patient Care Experiences and the Nurse Work Environment: A Longitudinal Study of U.S. Hospitals." Medical Care Research and Review. 2024;81(6):444–454.
- Kim S, Kitzmiller R, Baernholdt M, et al. "Patient Safety Culture: The Impact on Workplace Violence and Health Worker Burnout." Workplace Health & Safety. 2023;71(2):78–88.
- Roche M, Diers D, Duffield C, Catling-Paull C. "Violence Toward Nurses, the Work Environment, and Patient Outcomes." Journal of Nursing Scholarship. 2010;42(1):13–22.
- American Nurses Association. Position Statement on Workplace Violence, effective March 12, 2025.
- Emergency Nurses Association, Workplace Violence position statement, 2023. American Association of Critical-Care Nurses, Preventing Violence position statement.
- The Joint Commission, workplace violence prevention requirements, R3 Report Issue 30.
- Beattie J, Innes K, Griffiths D, Morphet J. "Workplace violence: Examination of the tensions between duty of care, worker safety, and zero tolerance." Health Care Management Review. 2020;45(3):E13–E22.
- Wand TC, Coulson K. "Zero tolerance: A policy in conflict with current opinion on aggression and violence management in health care." Australasian Emergency Nursing Journal. 2006;9(4):163–170.
Evaluation of the Vistelar program
- Cummings M, Tillema K. "An evaluation of an all-staff violence-reduction training program." Journal of Healthcare Protection Management. 2021;37(2):110–116.
Framework
- Vistelar Unified Conflict Management System, 6 C's of Conflict Management (© 2025 Vistelar, LLC).
Related Content from Vistelar
Ready for a Better Approach?
Healthcare systems across the country are rethinking how they approach workplace violence prevention training.
If you're exploring options for improving safety and training consistency across your organization, Vistelar can help.